Summer warming 1895-2023 in U.S. cities exaggerated by 100% from the urban heat island effect - Highlighted Article
From: Roy Spencer, Ph. D.
By: Roy W. Spencer, Ph. D.
Date: September 26, 2023
Summer warming 1895-2023 in U.S. cities exaggerated by 100% from the urban heat island effect
We are now getting close to finalizing our methodology for computing the urban heat island (UHI) effect as a function of population density, and will be submitting our first paper for publication in the next few weeks. I’ve settled on using the CONUS (Lower 48) U.S. region as a demonstration since that is where the most dense network of weather stations is. We are using NOAA’s V4 of the GHCN monthly dataset.
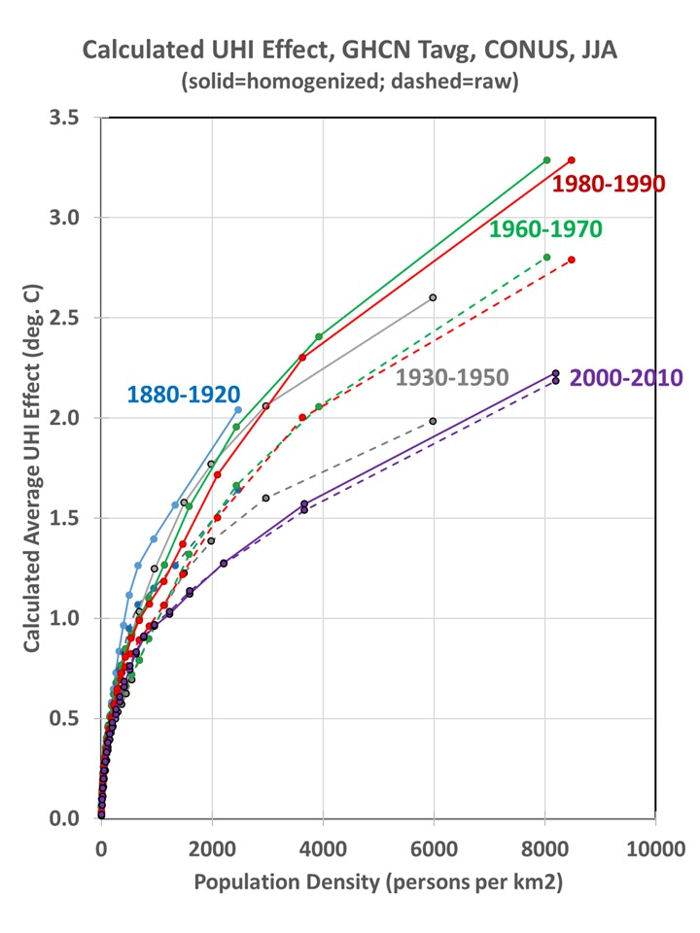
I’ve previously described the methodology, where I use many thousands of closely-spaced station pairs to compute how temperature between stations change with population density at 10×10 km resolution. This is done for 22 classes of 2-station average population density, and the resulting cumulative UHI curves are shown in Fig. 1. (continue reading)
Summer warming 1895-2023 in U.S. cities exaggerated by 100% from the urban heat island effect